Debugger and Interpreter mode
These docs are outdated, we are working on getting them up-to-date for the next release
O0.3
You can switch Debugger mode on only from the toolbar with the:
toggle, which switches debugger Mode on or off.
In debugger mode the packages and modules for your current project are loaded into GHCi.
In debugger mode, the menu entries from the Debug menu are no longer disabled (Fig [fig:Debug-=000026-Buffer]), and the context menu of source buffers have entries that were not meaningful in the regular (GHC) mode. There is also a group of panes specifically used for debugging, allowing you to manage breakpoints, observe variables, etc.
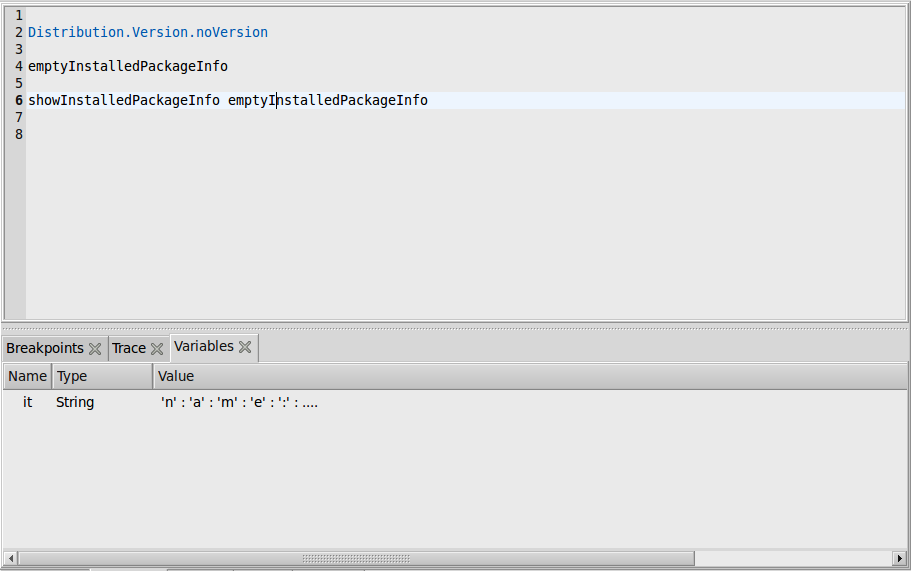
You can open the debugger group pane by choosing Panes / Debugger. Commands using the debugger are given mostly in the source editor pane with a context menu: You select some text and right-click to get the context menu. it lets you:
- Evaluate the selected expression in the interpreter and observe the result. If no text is selected the current line is taken as input. Select eval. The result of the evaluation is shown in the log window and as it in the variables pane. You can as well use the keystroke Ctrl-Enter.Choose “Eval & Insert”, to insert a string representation of the result after the selected expression.
Determine the type of an expression: Select the expression in a source buffer and select Type from the context menu.
Get info about an identifier select: Select Info from the context menu.
Get the kind of a type select: Select Kind
Step through code: Select the expression in a source buffer. Select step from the context menu (or F7). Use the toolbar icons (or shortcuts) for stepping
Step (F6), Step local (F7)
Step in module (F8), Continue (F9)
- Set breakpoints by putting the cursor at the breakpoint and select set breakpoint from the context menu. Run your application or test cases and start stepping at the break point. After a break point is reached you use the operations of GHCi with convenient shortcuts.
The debugger has a pane in which you can enter expressions and have them evaluated. The pane is a Haskell source buffer, which has the reserved name _Eval. Its contents is saved with the session.
Note that:
- breakpoints are set on identifiers selected, not necessarily where you have found it in the source (e.g., used in an expression);
- current breakpoints are listed in the breakpoints pane; you can remove breakpoints from this pane
- While stepping through code, you can observe variables in the variables pane. You can print or force a variable from the context menu of the variables pane. You can update the pane from the context menu.
- You can observe an execution trace in the traces pane. Navigation in the traces pane is currently not supported (:back, :forward).
- You can query information about the current state of GHCi from the Debugger menu. E.g. Show loaded modules, Show packages and Show languages.
- You can directly communicate with GHCi by evaluating commands entered as text in the source editor and select it. E.g. “:set …”
For more information about debugging in GHCi read the GHCi section in the GHC manual.
